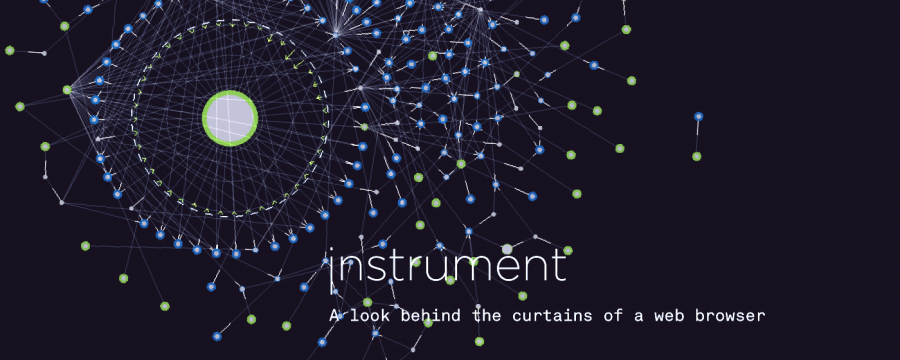
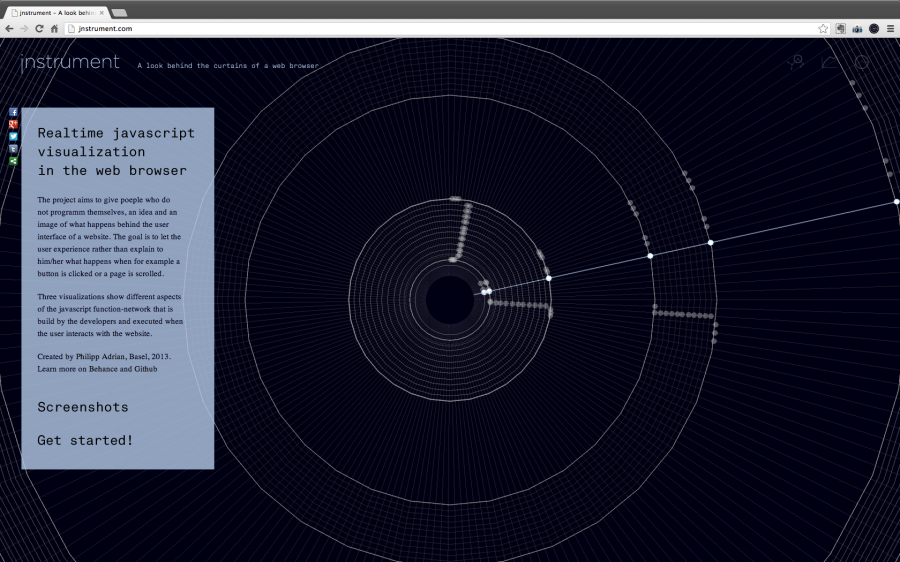
Realtime javascript visualization
The project aims to give people who do not programm themselves, an idea and an image of what happens behind the user interface of a website. The goal is to let the user experience rather than explain to him/her what happens when for example a button is clicked or a page is scrolled.
Three visualizations show different aspects of the javascript function-network that is build by the developers and executed when the user interacts with the website.
jnstrument is my bachelor thesis project for the school of arts in Basel, Switzerland created in summer '13. The project has been supervised by Indre Grumbnaite and Ludwig Zeller.
The Project is still work in progress. To learn more about the technical side and the source code, have a look at Github.
jnstrument.com
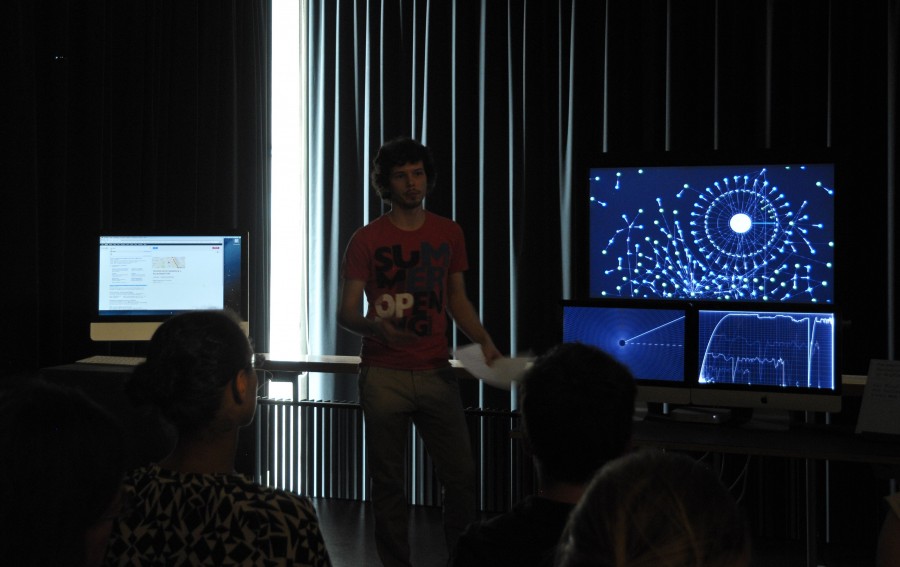
Installation
For the bachelor presentations, the project has been presented as installation and will be exhibited as such at the diploma exhibition in september 2013. Like this all three visualizations are visible at the same time and the visitor can use a terminal (left) to surf the web while his actions are visualized live.
Three Visualizations
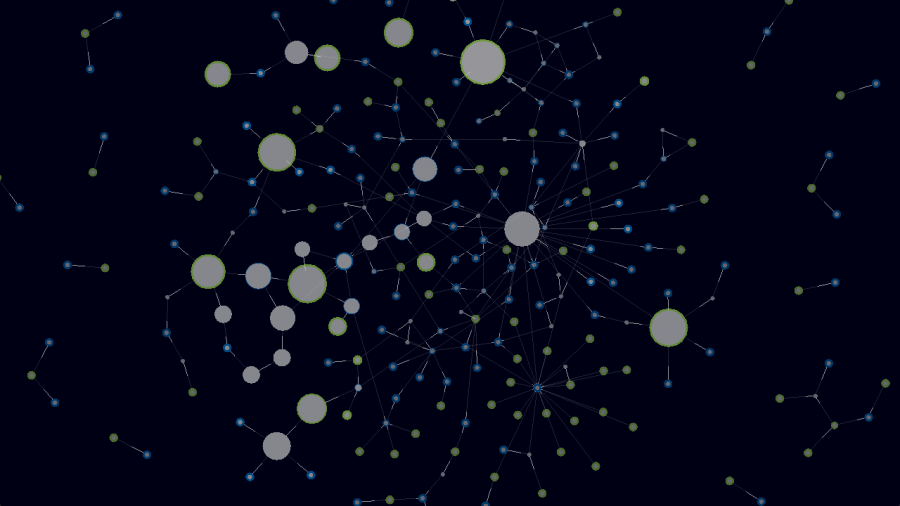
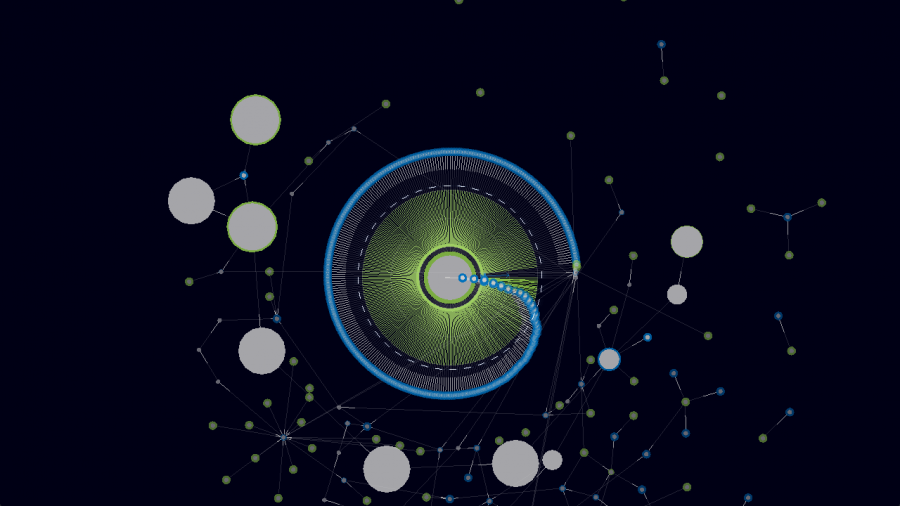
Visualization 1:
The javascript function network. Every executed function is connected to its caller and the functions it calls. Currently active functions are highlighted. Single functions can be selected to see where most of its work load comes from and to which function it gets passed along.
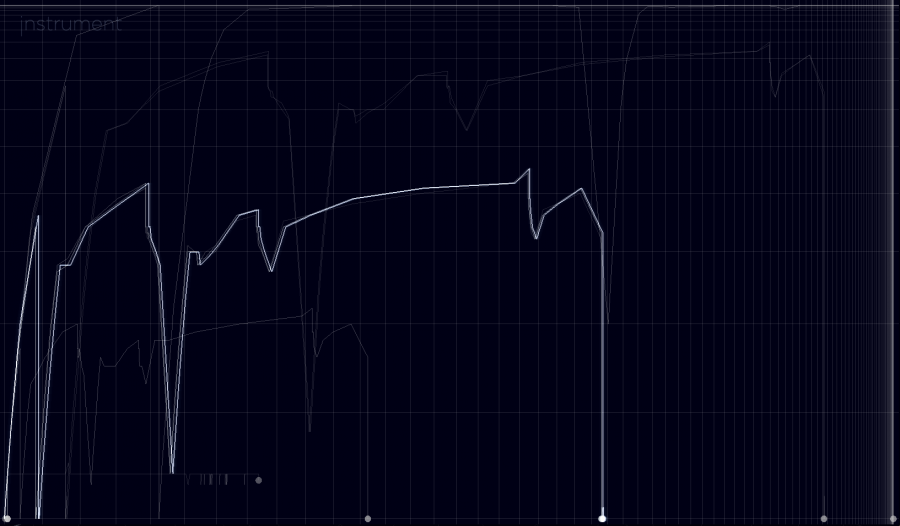
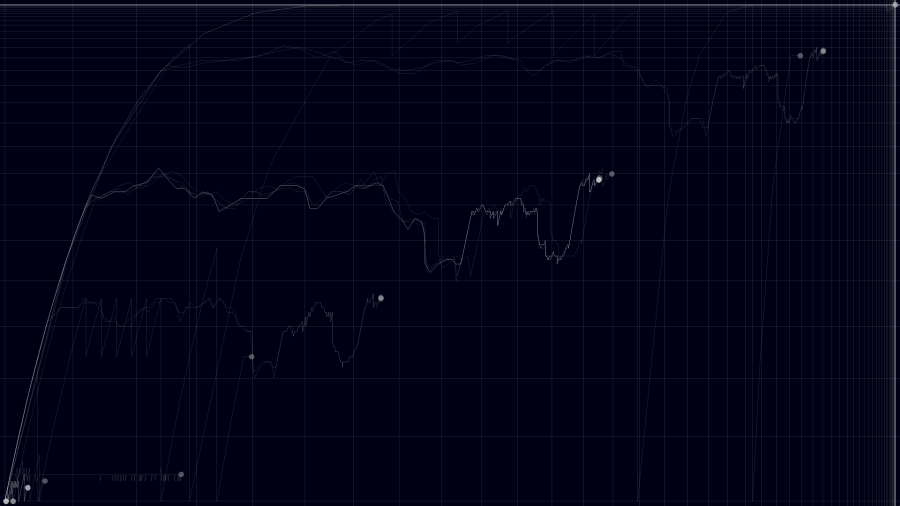
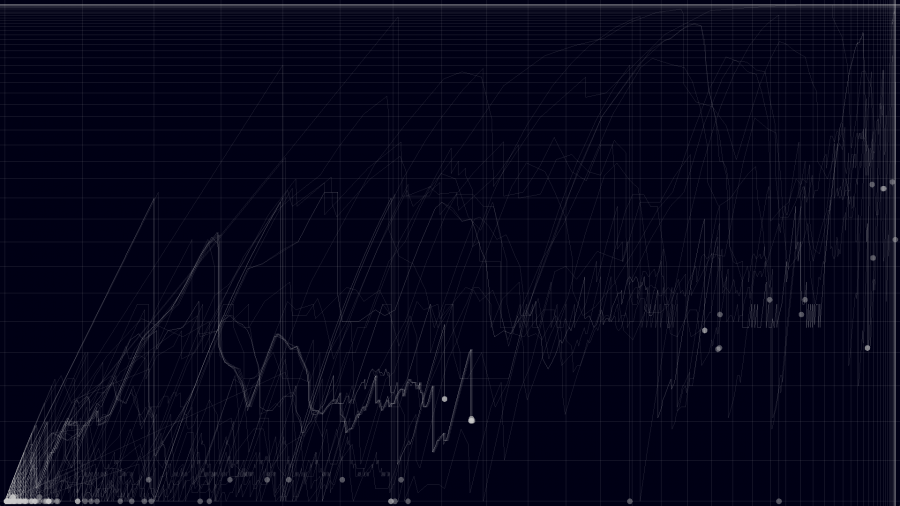
Visualization 2:
This Visualization shows the activity of the called javascript functions over time. A function rises on the graph when its active and falls when its not, moving to the right for every time its executed.
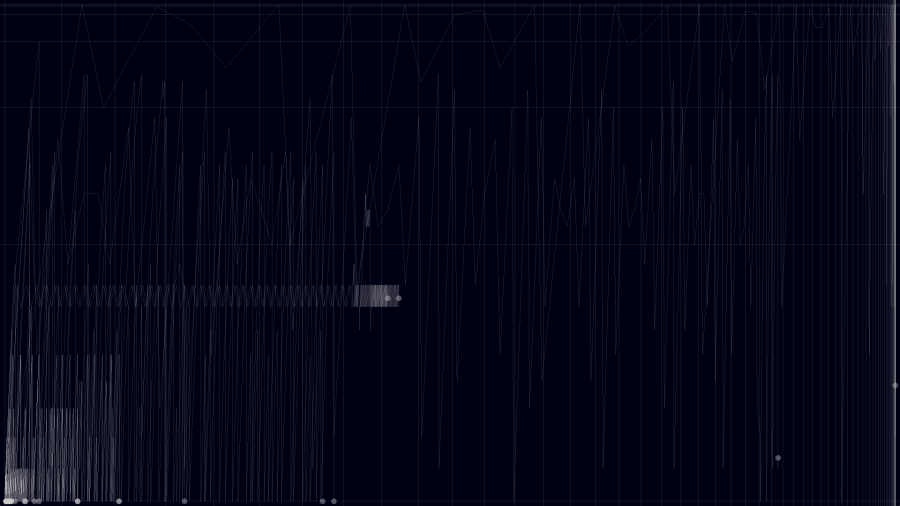
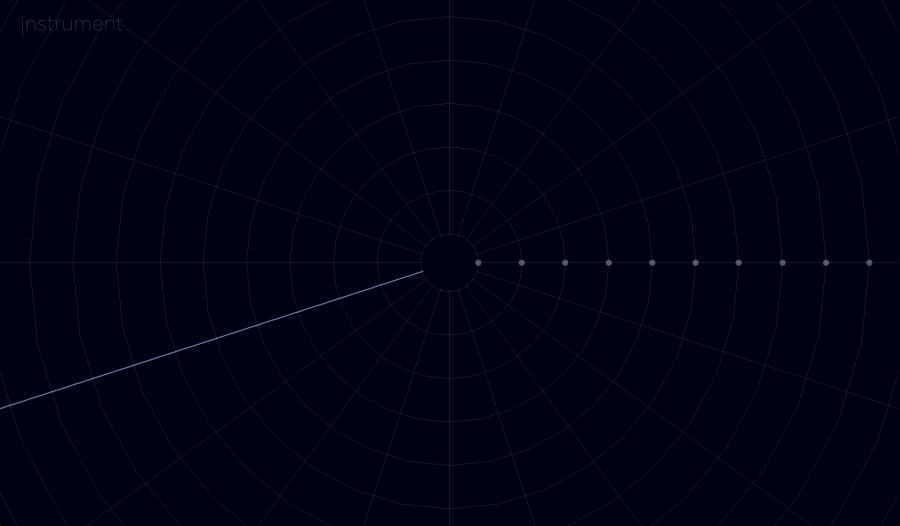
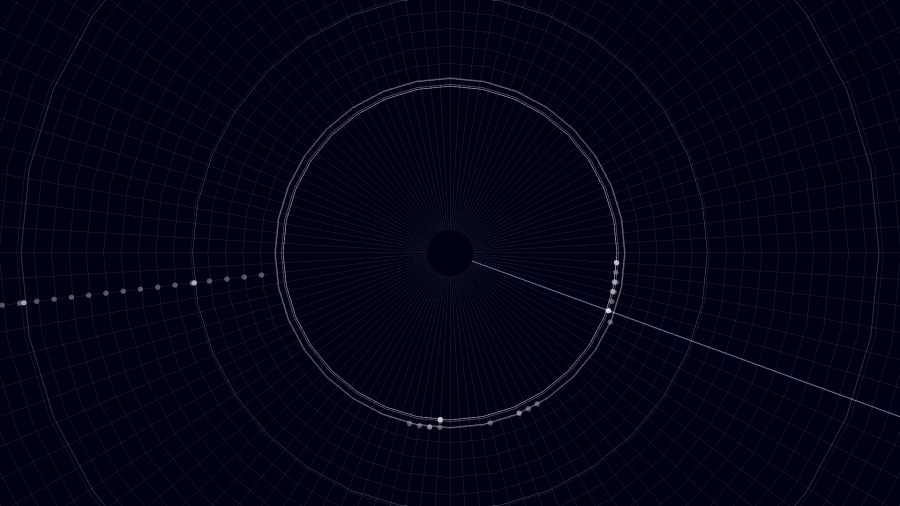
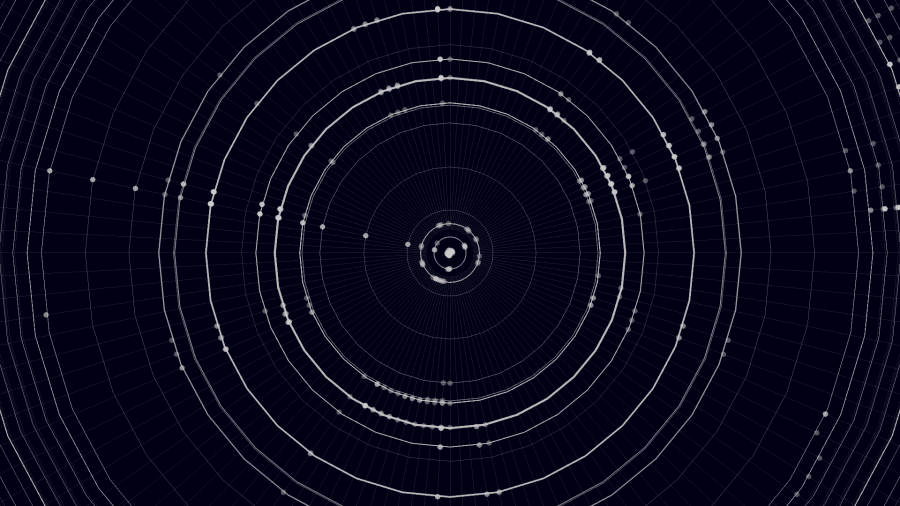
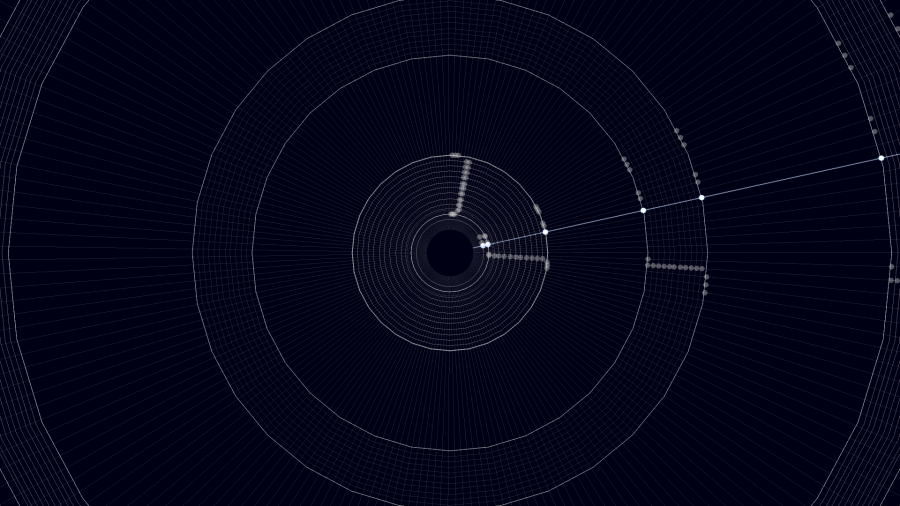
Visualization 3:
This visualizes the actual moment and everything that gets executed right now. It shows the work load that gets processed even when the website might seem idle. Every function is generated by a radially placed line and every function call generates a concentric circle.
Details
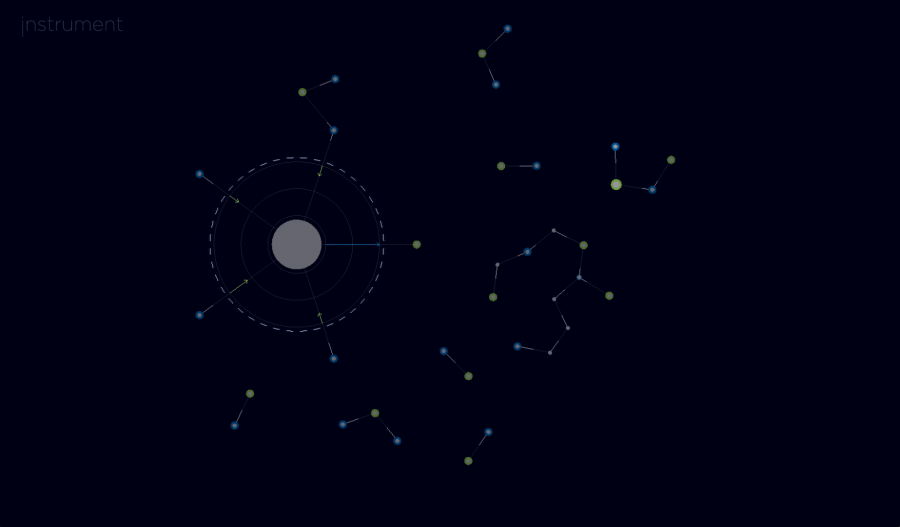
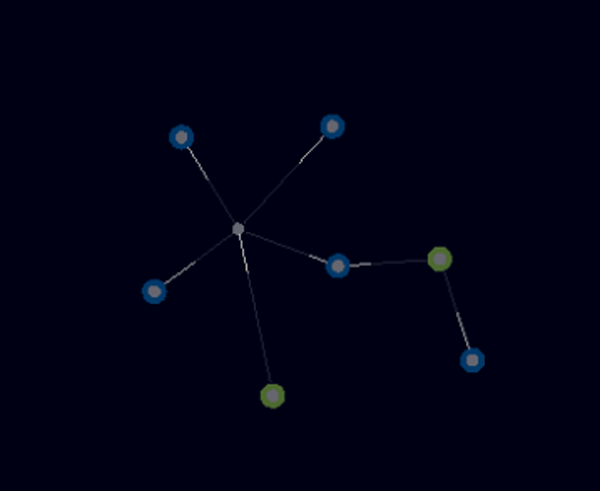
Function Network
Every function is connected to its caller and the functions it calls. The origin of the call is marked by stronger line, whos length depends on the amount of calls that go through that connection. Blue functions call more functions than they are being called. Green functions are more called then they call functions themselves.
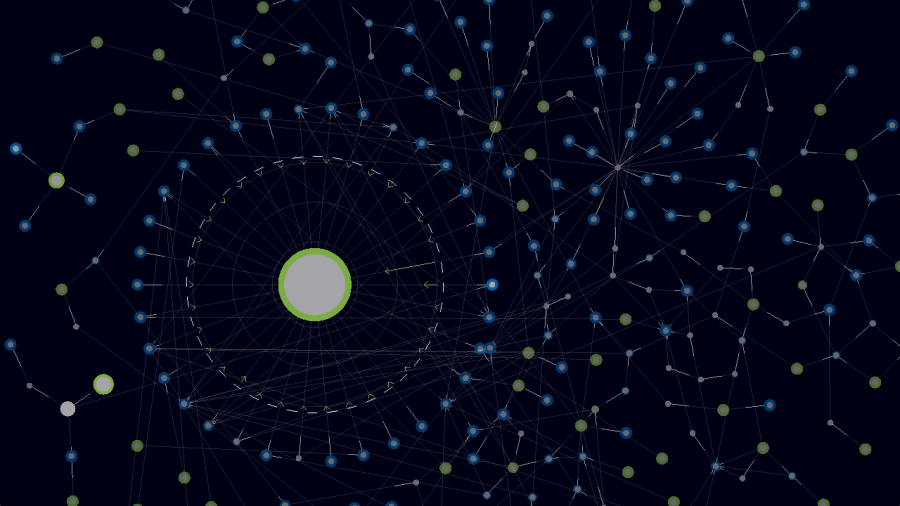
Selected Function
When selecting a function, one can see where this function gets called from and which functions it calls.

Selected Function Hightlight
When Selecting a function in the main visualization, this element gets hightlighted on all open visualizations. This is valuable when all three visualizations visible in the installation, so that the visualizations of the selected function can easily be compared.